Our project consists of two main topics: The creation of the data space and the analysis of the data.
Resilience analysis
Resilience
In simplified terms, a system is in balance if there is no external crisis; in this state, it exhibits a normal performance.
Example: Hospital A had a daily average of 20 unoccupied beds (UB) between 2016 and 2019.
When a crisis occurs, this normal state is suddenly disturbed. The system performance drops to a minimum value.
In the first months of the Covid-19 pandemic, hopsital A never has any unoccupied beds, that is an average of 0 UB.
Depending on the situation and the measures taken, the system recovers more or less quickly from the performance dip. The system performance eventually stabilizes at the old or a new level.
After 7 months, hospital A starts having some unoccupied beds again. In 2022, it reaches an average of 19 UB.
With this in mind, we can give a first definition of resilience: The smaller the performance dip and the shorter the recovery time of the system, the more resilient it is.
The Analysis
Let us consider another example:
Between 2016 and 2019, hospital B had a daily average of 50 UB. During the first months of the pandemic, it averaged 0 UB. After 11 months, the UB average stabilized at 55.
Evidently, the evolution of the performance UB differs between hospitals A and B. If we knew the underlying reason for that, we could optimize the availability of unoccupied beds in general — in an emergency, this could literally save lives. Now of course medical personnel could assess shortfalls encountered and recommend mitigations. However, this will be more and more difficult the more different hospitals we consider; and in Germany, there are well over a thousand hospitals. Furthermore, factors which so far have been discarded or not looked into may have an impact, too.
We thus want to collect as much data as possible to factually evaluate which systems — not just the hospitals used for the examples above — work best where, how and why.
The Goal
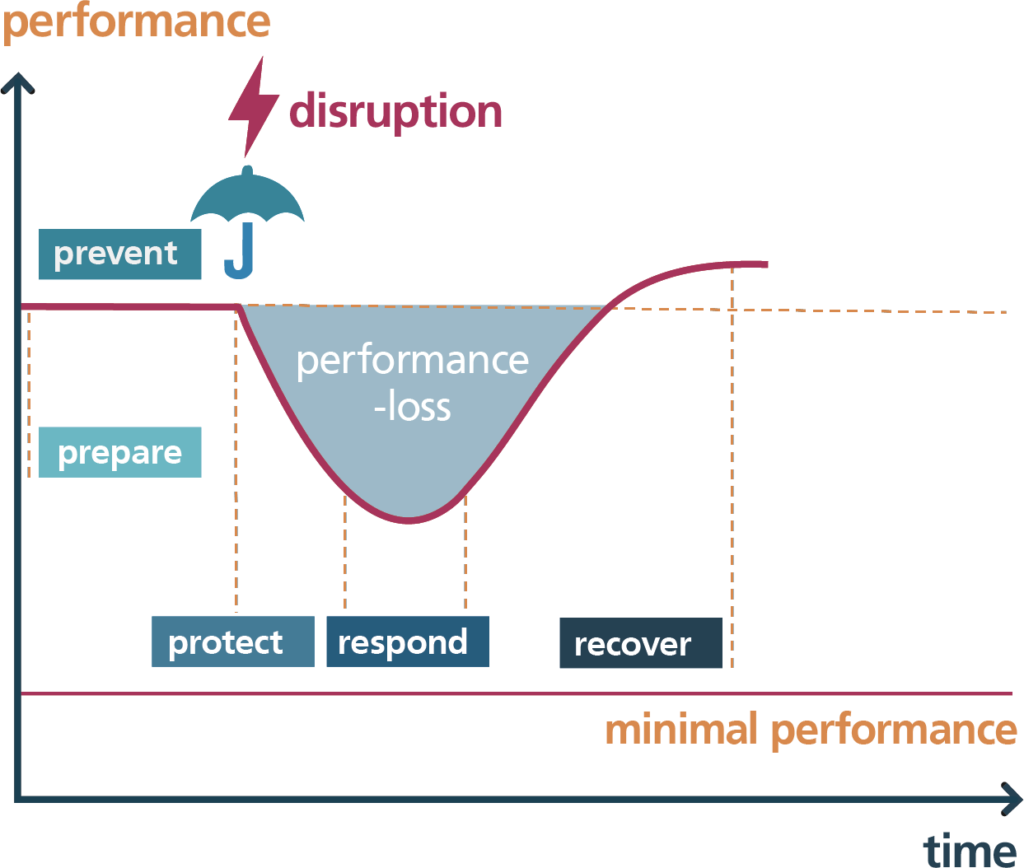
The system performance described above is sketched on the left as an exemplary performance curve over time. In addition, the five phases of resilience are denoted:
Prepare: »How can I best prepare against crises?«
Prevent: »How can I mitigate an evolving crisis?«
Protect: »How can I minimize the damage at the onset of the crisis?«
Respond: »How can I reduce the effects of the crisis?«
Recover: »How can I best recover from the crisis?«
On the one hand, we want to use data to analyze which decisions during these five phases had a significant impact on system performance. This would provide an objective, factual basis for the discussion of previously rather subjective perceptions such as, for instance, »We were poorly prepared for Corona«.
On the other hand, we want to find out what constitutes a good preparation and a good crisis management — in order to provide decision-makers with a basis for decision-making.
The Role Of Our Partners
We cannot compete with the expertise of experienced crisis managers, be they firefighters, emergency responders or policymakers — neither would we want to. Instead, we are pleased to have many highly competent partners on board who share their wealth of experience with us: For example, how important is the duration of a power outage, the local supply of drinking water, the serviceability of individual buildings, or government financial support? What data is particularly important in the short term but has been missing up to now?
Data Space
Architecture and Infrastructure
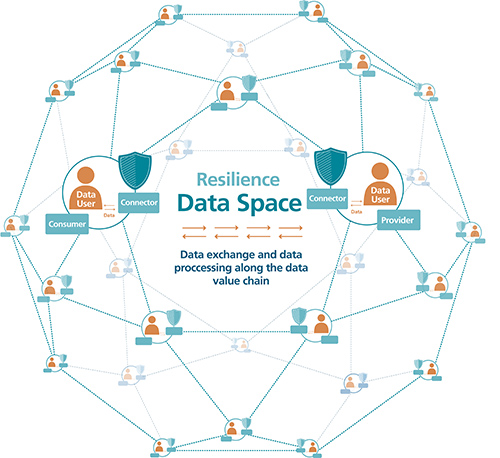
In order to obtain robust results from our analysis, we need as much finely resolved data as possible. Therefore we are working on creating a data space with as many participants as possible — all of whom will benefit from our analyses.
In this context, data privacy and sovereignty are quite important to us. The data is to be managed decentrally and exploited multilaterally, all while adhering to strict sovereignty standards. By using a standardized infrastructure, we want to ensure a low threshold for participation.
To this end, we are working on a system of data connectors that link data providers with data users.
Pre-Processing
Due to the large number of data sources and also data sets, we are employing modern methods to create a metadata catalog, in order to have as complete an overview as possible of which data is available where, in what quality, and how up to date it is.
In addition, it is important to bring the data onto a uniform basis — up to now, for example, social and weather data could not be easily combined due to different formats and resolutions.
Key Data
Name
HERAKLION – Heuristisc resilience analyses for municipalities via data space functionalities
Project type
Project sponsored by the BMBF in the context of its security research (www.sifo.de)
Term
3/2022 – 2/2026
Sponsor
Federal Ministry of Education and Research (BMBF)
Budget
€ 5.6m
Goal
Data space demonstrator for the use cases pandemic and extreme weather